Verified on the map
Query is checked against real geography before Claude trusts a single number.
Claude and Codex use Dekart to run and verify analysis on a map, so you get reliable answers and live dashboards everyone can use


Language models will always give you an answer, even when it probably shouldn't. Dekart gives the agent a map harness, so Claude loops on SQL → Map, checking every result against real geography until it holds up, and fixing itself when it doesn’t.
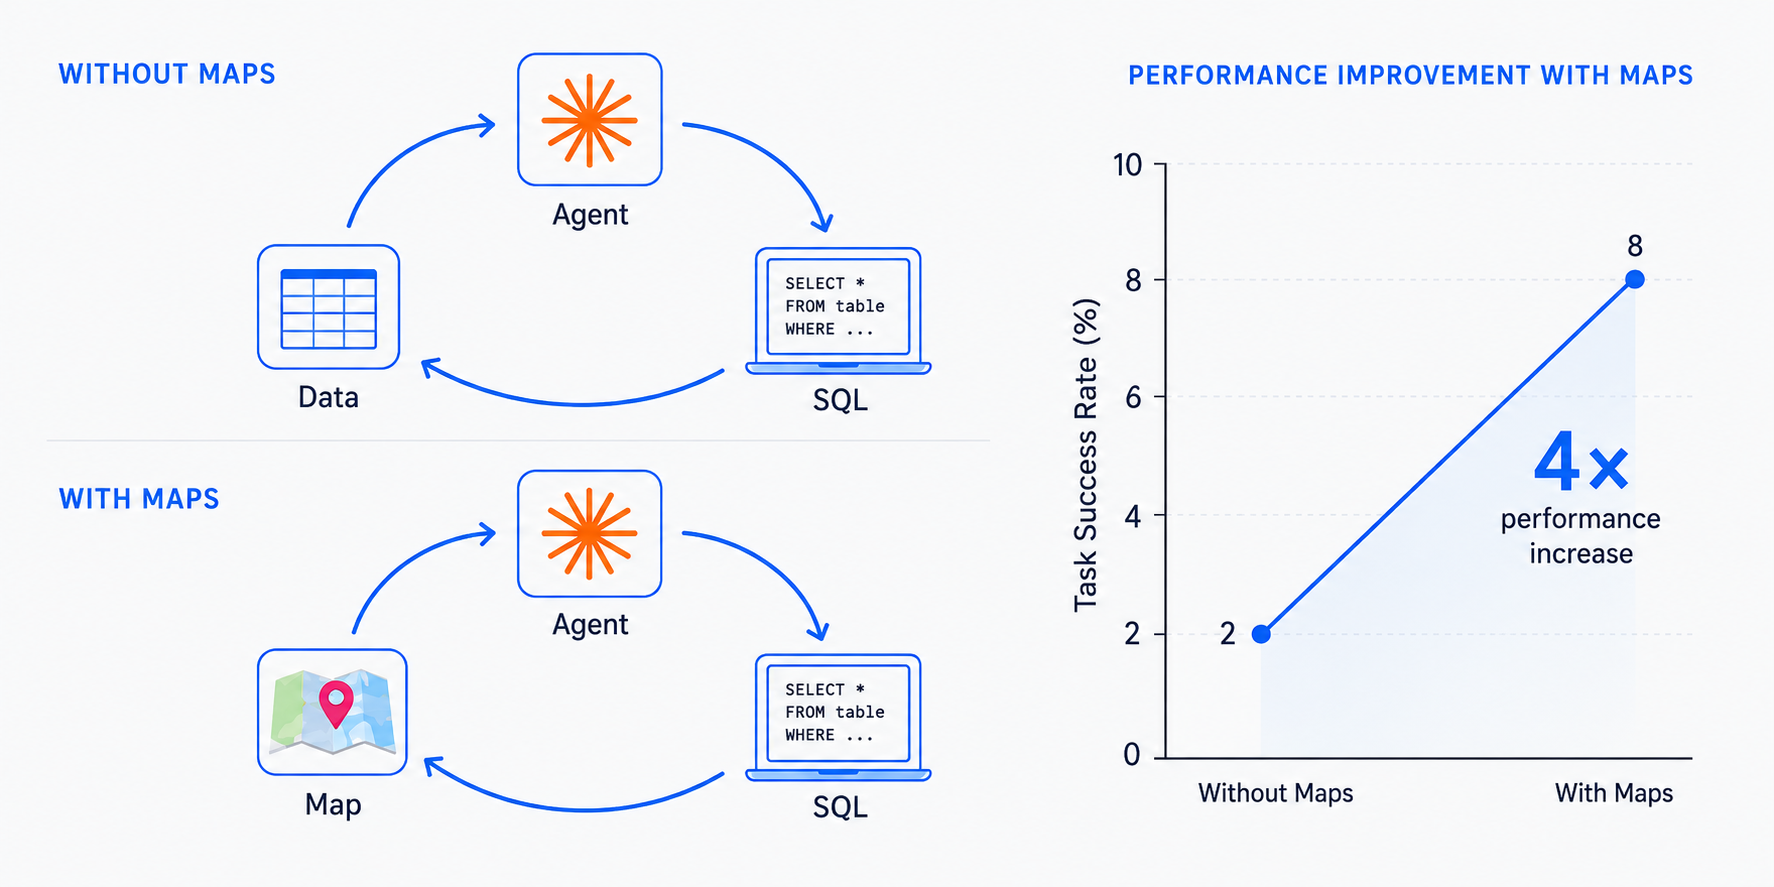
Query is checked against real geography before Claude trusts a single number.
Implausible results get caught and corrected inside the loop, never shipped as confident nonsense.
Connect your database and point Claude to your docs to perform analyzes your unique way.

Distinguished Data Scientist
Geotab
Over the last year we have been migrating our geospatial data visualization out of jupyter notebooks and various ad-hoc tools onto the Dekart.
Sharing investigations and results with other teams at the company is seamless and I have one-stop-shop for all of my saved maps.
The feedback from the rest of the data science team has been unanimously positive.

VP of Data
Electra
Visualizing data on maps can be super effective to understand local dynamics. For communication, maps never disappoint.
We are really glad to have found a tool that connects to our data warehouse and allows us to handle geospatial data at scale and very easily.
I made this map with one SQL query and took just a few minutes to ensure that it looks good!